How Devint turns data into a clear view of performance.
The DevScore combines automatic signals from the development workflow with leadership reviews, comparing each person against stable reference ranges — not against the best on the team. Weights and ranges are configurable: your company defines what it values, per role.
It all starts with a single view of performance
This is not an internal ranking: each person is read against healthy operating ranges. If the team improves, nobody ends up "in last place".
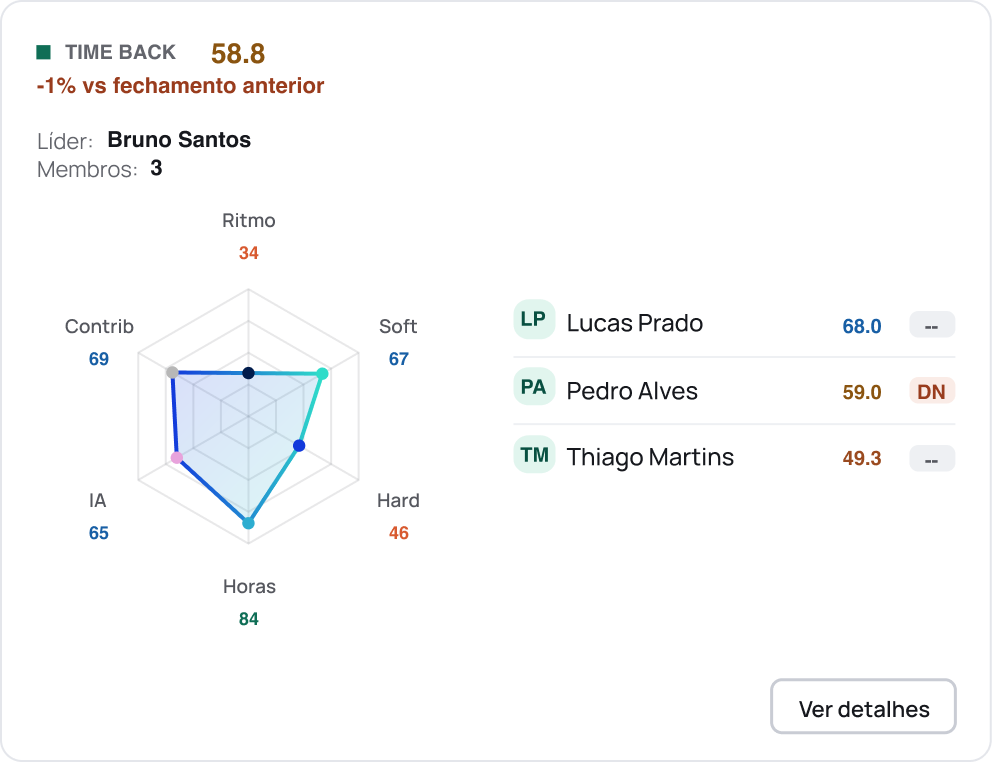
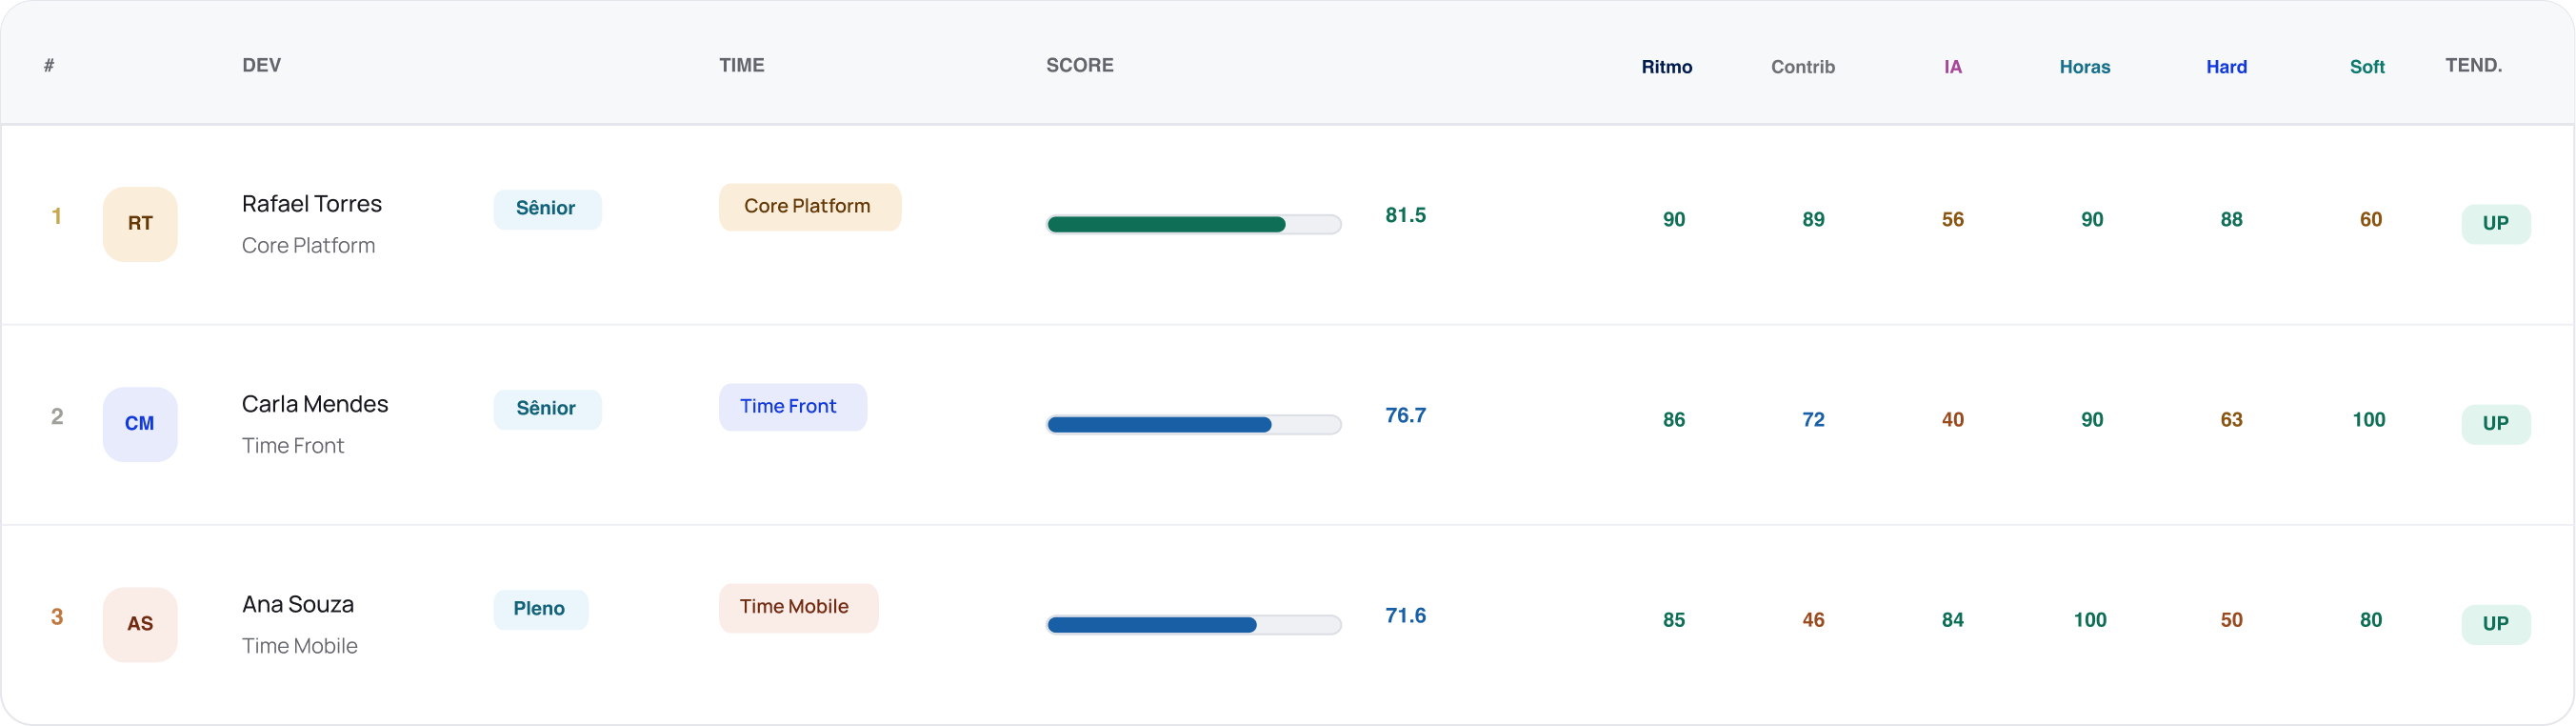
A single score scale, per person and per team. The dimensions explain where the number comes from.
Dimensions evaluated, each with its own weight and saturation ceiling.
Between closings: a trend reading, with no day-to-day micromanagement.
Of full window in each closing, to reduce noise from atypical days.
Illustrative example: mid-level profile with a DevScore of 84 at closing.
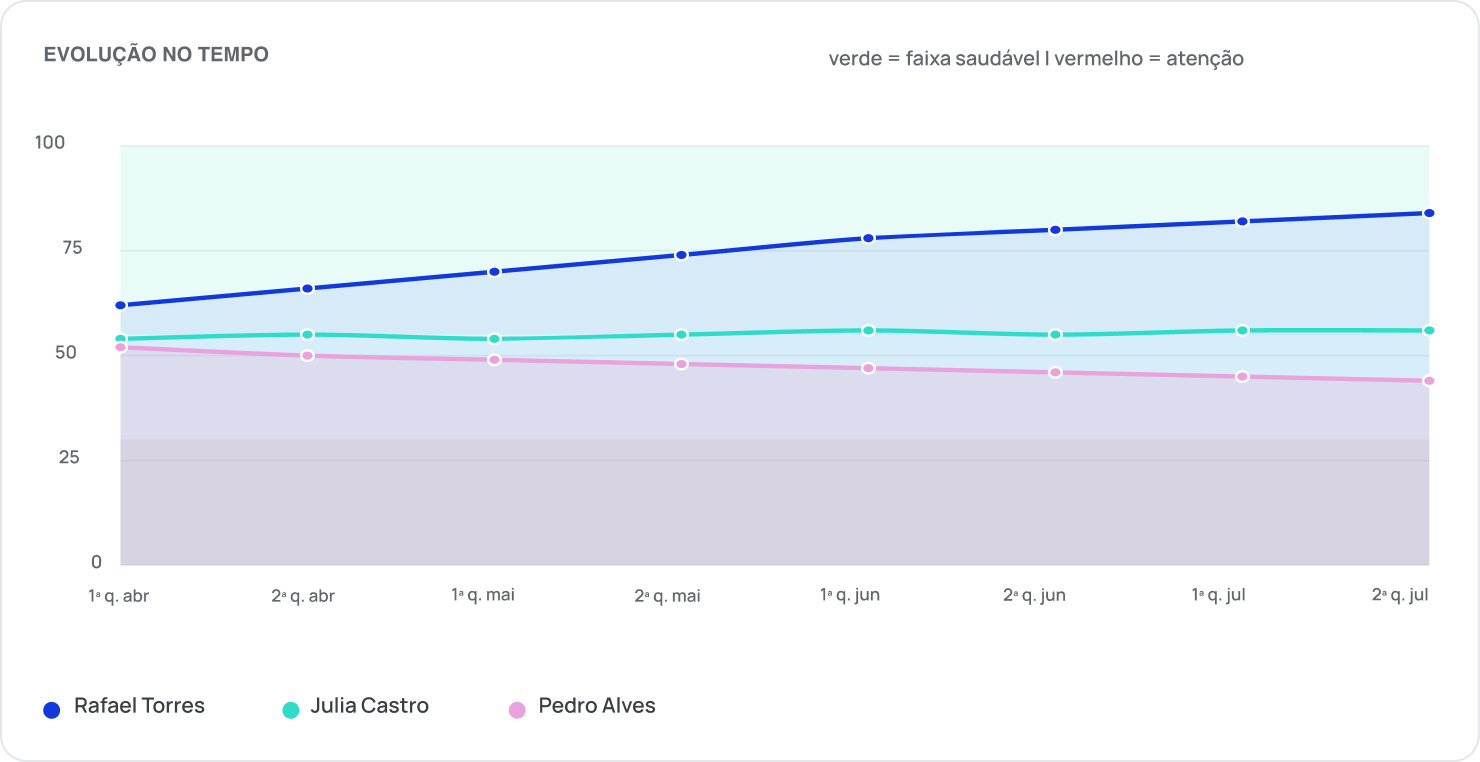
See progress over time.
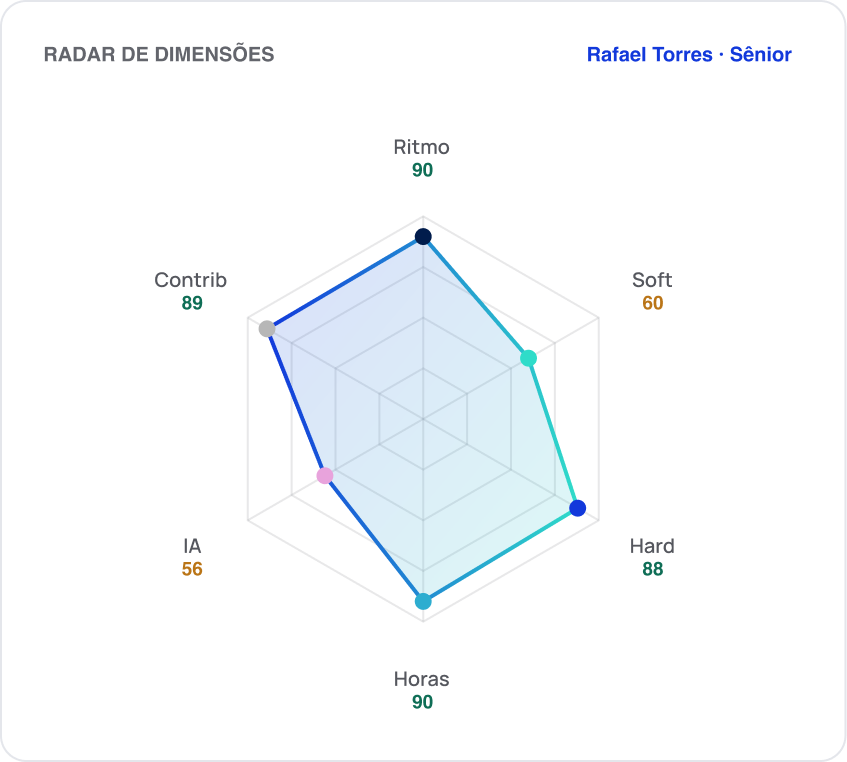
At each biweekly closing, the six dimensions form a hexagon: each vertex shows the position against the healthy range, from 0 to 100. The shape reveals consistency and room to grow before the final number. Other periods can be filtered as well.
Behind the score, different dimensions reveal what is really going on
No single dimension defines productivity on its own: automatic signals show the period; leadership shows maturity. The weight of each one is configurable per role.
Delivery paceA commit is the traceable record of a change to the code; a pull request is the request to review and integrate that change.
Commits/business day +Pull requests/week
How often technical work becomes a reviewable delivery. A healthy pace reduces the risk of surprises; smaller, frequent deliveries make review and feedback easier.
Configurable weightContributionAlive lines are the lines that remain active in the product over time — contribution that generated real value.
Alive lines +Change entropy
Technical contribution that leaves a material mark on the product: code that stays and structural changes, including useful removals during refactoring.
Configurable weightAI adoptionTokens are the units of text processed by AI tools — consumption indicates the actual level of use at work.
Tokens consumed per weekReal adoption of AI tools in the workflow. It measures use, not value delivered — it should be read together with the other dimensions.
Configurable weightLogged hoursHours logged by the dev provide predictability and capacity visibility, and support cost analysis.
Hours logged per weekCompleteness of time tracking and predictability. Without reliable logging, capacity becomes opinion. Logging above the ceiling does not raise the score.
Configurable weightHard skillsCode quality, architecture, best practices and command of the technologies, evaluated by those who lead technically.
Manager + tech lead review (1–9)Planning, execution and autonomy. Describes observed technical maturity — more stable than period metrics, it changes slowly.
Configurable weightSoft skillsCommunication, collaboration, autonomy and organization — professional maturity and impact on the work environment.
Manager + tech lead review (1–6)Communication, accountability, predictability and collaboration. It measures behavioral impact on how the team works, not likability.
Configurable weight
Junior

Mid-level

Senior
Because every role carries different expectations
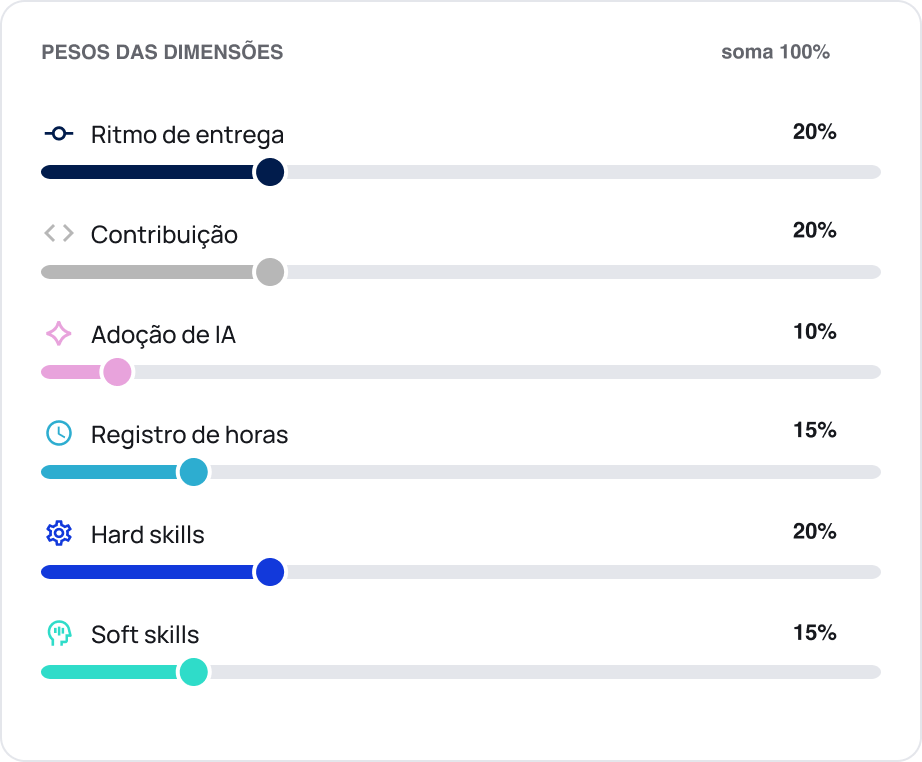
What is expected of a junior is not what is expected of a senior: weights and ranges are configurable per level or job title, adding up to 100%. Companies accelerating AI adoption increase the weight of that dimension; those that need predictability, the weight of hours.
The charts alongside show an example configuration for each level. Use the arrows to compare.
And every result needs context to make sense
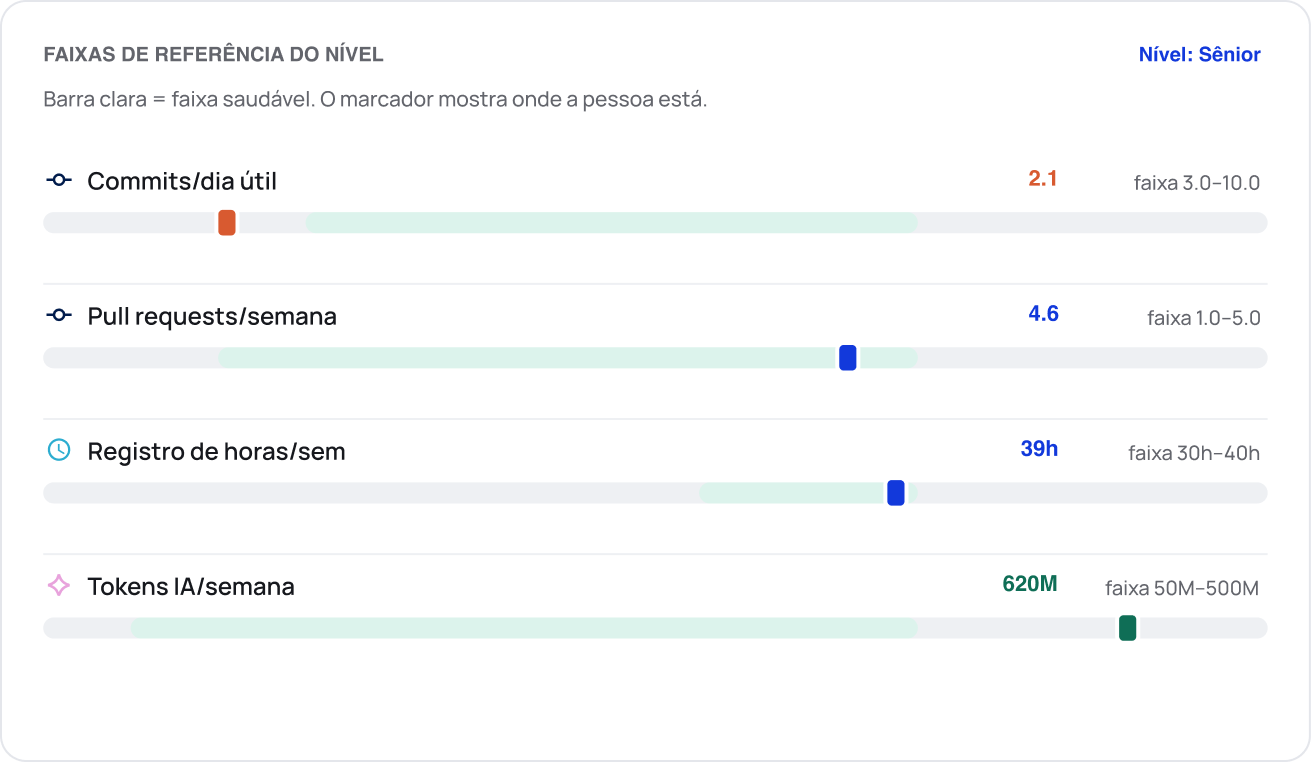
Each signal is read against a healthy range, with a floor and a ceiling, configurable per role. Reading parameters, not blind targets.
| Dimension | What it observes | Example range* | Why it matters |
|---|---|---|---|
| Delivery pace | Commits per business day | 3 to 10 /day | Shows continuity of work |
| Delivery pace | Pull requests per week | 1 to 5 /week | Shows the cadence of reviewable delivery |
| Contribution | Alive lines | 1K to 8K /cycle | Shows contribution that remains present in the product |
| Contribution | Change entropy | 1K to 3.5K /cycle | Shows the breadth of technical work |
| AI adoption | Tokens consumed | 50M to 500M /week | Shows operational adoption of modern tools |
| Logged hours | Hours logged | 30h to 40h /week | Shows completeness of time tracking and predictability |
| Hard skills | Technical review (manager + tech lead) | Scale of 1 to 9 | Shows observed technical maturity |
| Soft skills | Behavioral review (manager + tech lead) | Scale of 1 to 6 | Shows observed collaborative maturity |
*The values above are a reference configuration. Each company adjusts the ranges by seniority level, contract type, working hours and nature of the work — with governance: adjustments apply only to upcoming closings, preserving closed history.
See the DevScore applied to your context.
Book a demo and explore the dimensions, ranges and levels with your team's data.